

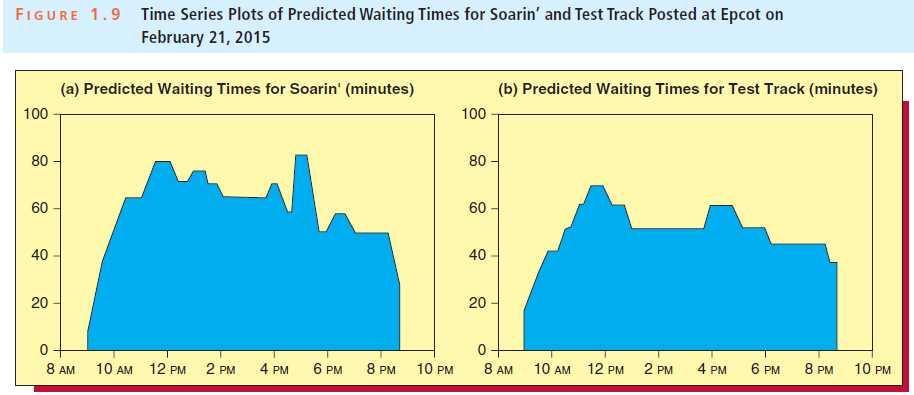
The time series plots in Figure 1.9 tell us that the predicted waiting times for Soarin and
Question:
Figure 1.9
Fantastic news! We've Found the answer you've been seeking!
Step by Step Answer:
Test Tra...View the full answer

Answered By
Utsab mitra
I have the expertise to deliver these subjects to college and higher-level students. The services would involve only solving assignments, homework help, and others.
I have experience in delivering these subjects for the last 6 years on a freelancing basis in different companies around the globe. I am CMA certified and CGMA UK. I have professional experience of 18 years in the industry involved in the manufacturing company and IT implementation experience of over 12 years.
I have delivered this help to students effortlessly, which is essential to give the students a good grade in their studies.
2+ Reviews
10+ Question Solved
Related Book For 
Business Statistics In Practice Using Data Modeling And Analytics
ISBN: 9781259549465
8th Edition
Authors: Bruce L Bowerman, Richard T O'Connell, Emilly S. Murphree
Question Posted:
