

Recall that Table 1.8 presents the satisfaction ratings for the XYZ-Box video game system that have been
Question:
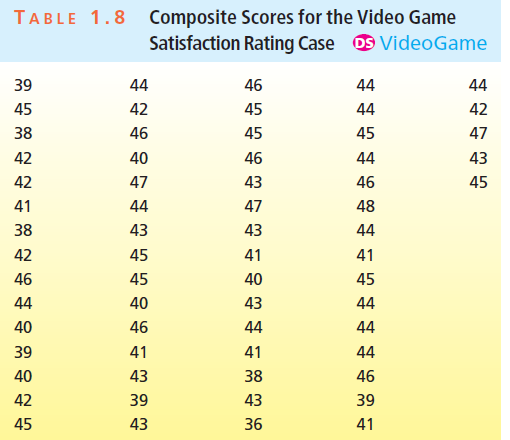
Figure 2.15
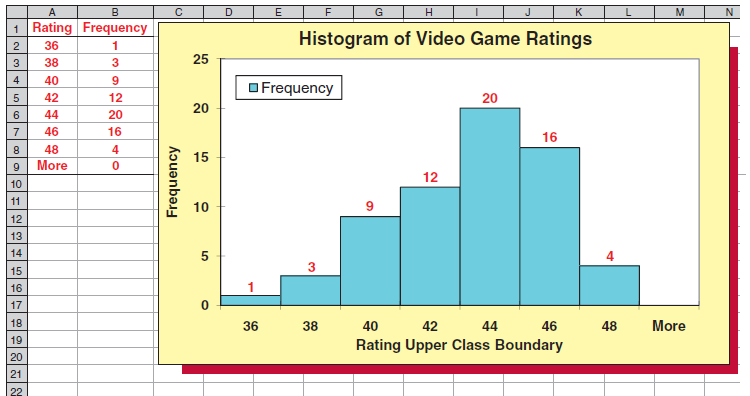 a. Describe where the satisfaction ratings seem to be concentrated.
b. Describe and interpret the shape of the distribution of ratings.
c. Write out the eight classes used to construct this histogram.
d. Construct a cumulative frequency distribution of the satisfaction ratings using the histogram classes.
The word "distribution" has several meanings in the financial world, most of them pertaining to the payment of assets from a fund, account, or individual security to an investor or beneficiary. Retirement account distributions are among the most...
Fantastic news! We've Found the answer you've been seeking!
Step by Step Answer:
a The video game satisfaction ratings are concentrated between 40 and 46 ...View the full answer

Answered By
OTIENO OBADO
I have a vast experience in teaching, mentoring and tutoring. I handle student concerns diligently and my academic background is undeniably aesthetic
3+ Reviews
10+ Question Solved
Related Book For 
Business Statistics In Practice Using Data Modeling And Analytics
ISBN: 9781259549465
8th Edition
Authors: Bruce L Bowerman, Richard T O'Connell, Emilly S. Murphree
Question Posted:
