

Recall that Table 1.9 presents the waiting times for teller service during peak business hours of 100
Question:
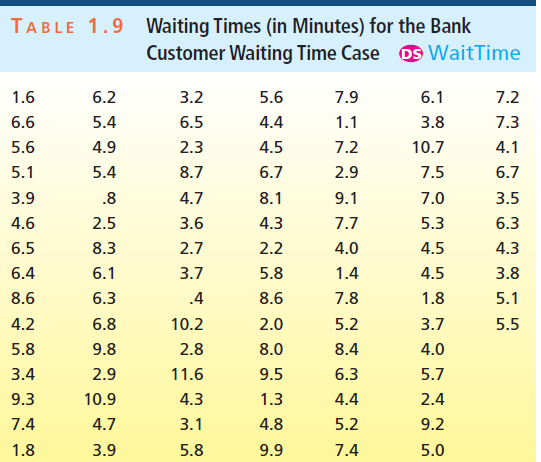
Figure 2.16 above gives the Minitab output of a histogram of these waiting times that has been constructed using automatic classes.
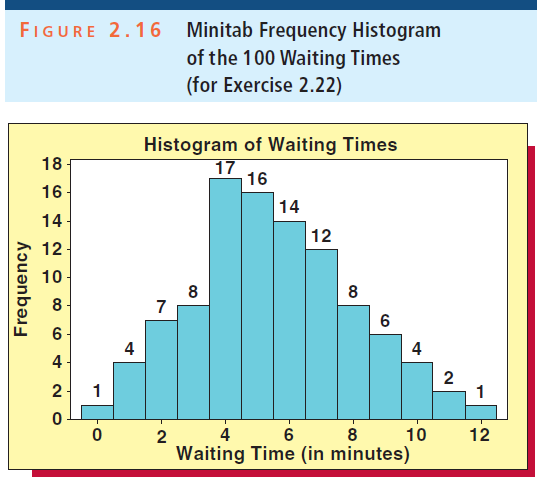
a. Describe where the waiting times seem to be concentrated.
b. Describe and interpret the shape of the distribution of waiting times.
c. What is the class length that has been automatically defined by Minitab?
d. Write out the automatically defined classes and construct a cumulative percent frequency distribution of the waiting times using these classes.
The word "distribution" has several meanings in the financial world, most of them pertaining to the payment of assets from a fund, account, or individual security to an investor or beneficiary. Retirement account distributions are among the most...
Fantastic news! We've Found the answer you've been seeking!
Step by Step Answer:
a The bank wait times are concentrated between 4 and 9 minutes You might ...View the full answer

Answered By
Joseph Ogoma
I have been working as a tutor for the last five years. I always help students to learn and understand concepts that appears challenging to them. I am always available 24/7 and I am a flexible person with the ability to handle a wide range of subjects.
1+ Reviews
10+ Question Solved
Related Book For 
Business Statistics In Practice Using Data Modeling And Analytics
ISBN: 9781259549465
8th Edition
Authors: Bruce L Bowerman, Richard T O'Connell, Emilly S. Murphree
Question Posted:
