

Table 3.4 on page 208 shows the number of points scored and penalty minutes for 24 ice
Question:
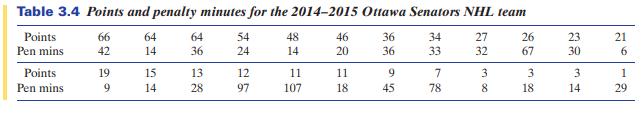
Table 3.4 on page 208 shows the number of points scored and penalty minutes for 24 ice hockey players on the Ottawa Senators NHL team for the 2014-2015 season. The data are also stored in OttawaSenators. Assume that we consider these players to be a sample of all NHL players.
(a) Create a dotplot of the distribution of penalty minutes (PenMin) for the original sample of 24 players. Comment on the shape, paying particular attention to skewness and possible outliers.
(b) Find the mean and standard deviation of the penalty minute values for the original sample.
(c) Use StatKey or other technology to construct a bootstrap distribution for the mean penalty minutes for samples of size \(n=24\) NHL players. Comment on the shape of this distribution, especially compared to the shape of the original sample.
(d) Compute the standard deviation of the bootstrap means using the distribution in part (c). Compare this value to the standard deviation of the penalty minutes in the original sample.
(e) Construct a \(95 \%\) confidence interval for the mean penalty minutes of NHL players.
(f) Give a reason why it might not be reasonable to use the players on one team as a sample of all players in a league.
Step by Step Answer:


Statistics, Enhanced Unlocking The Power Of Data
ISBN: 9781119308843
2nd Edition
Authors: Robin H Lock, Patti Frazer Lock, Kari Lock Morgan, Eric F Lock, Dennis F Lock
