

The following data show the average prices for S&P Case-Shiller U.S. National Home Price Index in the
Question:
The following data show the average prices for S&P Case-Shiller U.S. National Home Price Index in the United States over a six-quarter period.
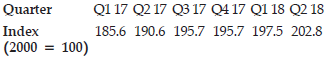
a. Forecast the price index for Q3 2018 using a two-period simple moving average.
b. Calculate the MAD for the forecast in part a.
c. Forecast the price index for Q3 2018 using a threeperiod simple moving average.
d. Calculate the MAD for the forecast in part b.
e. Which forecast would you choose?
Fantastic news! We've Found the answer you've been seeking!
Step by Step Answer:
a b MAD 18154 454 c d MAD 1513 50 e The foreca...View the full answer

Answered By
Issa Shikuku
I have vast experience of four years in academic and content writing with quality understanding of APA, MLA, Harvard and Chicago formats. I am a dedicated tutor willing to hep prepare outlines, drafts or find sources in every way possible. I strive to make sure my clients follow assignment instructions and meet the rubric criteria by undertaking extensive research to develop perfect drafts and outlines. I do this by ensuring that i am always punctual and deliver quality work.
6+ Reviews
13+ Question Solved
Related Book For 
Question Posted:
