

The following table lists market share for cell phone operating systems for Q1 2017. Construct a display
Question:
The following table lists market share for cell phone operating systems for Q1 2017.
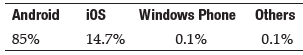
Construct a display that best describes these data
Fantastic news! We've Found the answer you've been seeking!
Step by Step Answer:
A pie chart is the best choice for this d...View the full answer

Answered By
Carly Cimino
As a tutor, my focus is to help communicate and break down difficult concepts in a way that allows students greater accessibility and comprehension to their course material. I love helping others develop a sense of personal confidence and curiosity, and I'm looking forward to the chance to interact and work with you professionally and better your academic grades.
12+ Reviews
21+ Question Solved
Related Book For 

Question Posted:
