

The following table shows the U.S. market share for automotive manufacturers in 2013. Also shown is the
Question:
The following table shows the U.S. market share for automotive manufacturers in 2013. Also shown is the frequency of car purchases by manufacturer from a random sample of 220 customers in March of 2018 (www.motorintelligence.com).
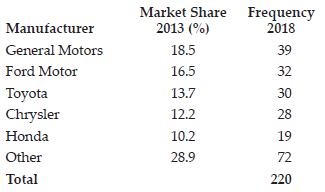
a. Using ? = 0.10, perform a chi-square test to determine if the U.S. market share in the automotive industry has changed between 2013 and 2018.
b. Determine the p-value for the chi-square test statistic using Excel and interpret its meaning.
Fantastic news! We've Found the answer you've been seeking!
Step by Step Answer:
a H 0 US market share for cars did not change between 2013 and 2014 ...View the full answer

Answered By
Sandhya Sharma
I hold M.Sc and M.Phil degrees in mathematics from CCS University, India and also have a MS degree in information management from Asian institute of technology, Bangkok, Thailand. I have worked at a international school in Bangkok as a IT teacher. Presently, I am working from home as a online Math/Statistics tutor. I have more than 10 years of online tutoring experience. My students have always excelled in their studies.
119+ Reviews
214+ Question Solved
Related Book For 

Question Posted:
