

Question: The scatterplot shows, for 2015 cars, the carbon footprint (tons of CO 2 per mile) vs. the new Environmental Protection Agency (EPA) highway mileage for
The scatterplot shows, for 2015 cars, the carbon footprint (tons of CO2 per mile) vs. the new Environmental Protection Agency (EPA) highway mileage for 69 family sedans as reported by the U.S. government (www.fueleconomy.gov/feg/byclass.htm); the cars in the lower right of the scatterplot plotted in red are all hybrids.
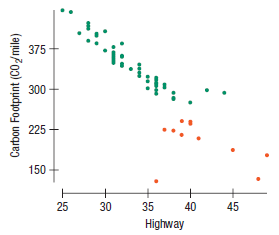
a) The correlation is -0.860. Describe the association.
b) Are the assumptions and conditions met for computing correlation?
c) Using technology, find the correlation of the data when the hybrid cards are not included with the others. Can you explain why it changes in that way?
375 300 225 150 + 30 25 35 40 45 Highway Carbon Footprint (CO/mile)
Step by Step Solution
3.49 Rating (162 Votes )
There are 3 Steps involved in it
a There is a strong negative linear association between ... View full answer

Get step-by-step solutions from verified subject matter experts