

The table below shows the number of injuries in Canada from some forms of transport accidents by
Question:
The table below shows the number of injuries in Canada from some forms of transport accidents by gender, in 2011:
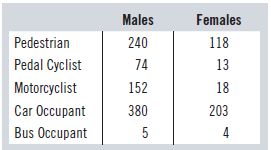
a) If possible, calculate the percentage of male injuries from transport accidents that are pedestrians. If this is not possible, state why not.
b) If possible, calculate the percentage of pedal cyclist injuries from transport accidents that are females. If this is not possible, state why not.
c) An analyst concludes, “Women are safer motorcyclists than men.” Comment on the ethics of this statement, with reference to the ethical guidelines in Appendix C.
d) An analyst concludes, “Bus is the safest form of transport.” Comment on the ethics of this statement, with reference to the ethical guidelines in Appendix C.
e) Draw a chart comparing male and female injuries in transport accidents using the information above, adding a footnote regarding the completeness of the source information. Give your reason for your choice of chart.
Step by Step Answer:
a Not possible since we do not have all categories of people eg truck aircraft occupants b 137...View the full answer


Business Statistics
ISBN: 9780133899122
3rd Canadian Edition
Authors: Norean D. Sharpe, Richard D. De Veaux, Paul F. Velleman, David Wright
