

The table shows monthly time-series data for short-term visits to the United Kingdom and its territories by
Question:
The table shows monthly time-series data for short-term visits to the United Kingdom and its territories by Australian residents.
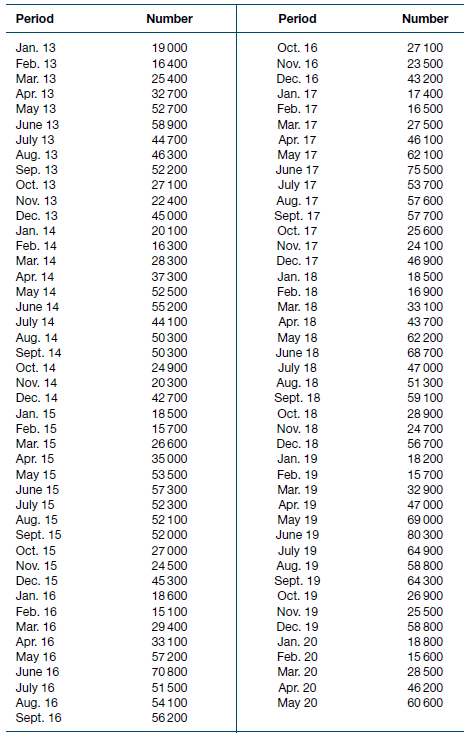
(a) Explore trends in these data by using linear and quadratic trend models. Comment on the performance of these models.
(b) Use a 10-month MA to forecast values for January 2014 to May 2020.
(c) Use simple exponential smoothing to forecast values for January 2014 to May 2020. Let ? = 0.3 and then = 0.7. Which weight produces better forecasts?
(d) Compute the MAD for the forecasts obtained in parts (b) and (c) and compare the results.
(e) Determine seasonal effects using decomposition on these data. Let the seasonal effects have four periods. After determining the seasonal indices, deseasonalise the data.

Step by Step Answer:
a The linear trend model gives the following result Y 350077 1155X R 2 030 s e 171659 The quadratic model gives the following result Y 331847 2357X 134X 2 adjusted R 2 01 s e 172468 The linear trend m...View the full answer


Business Analytics And Statistics
ISBN: 9780730363330
1st Edition
Authors: Ken Black, John Asafu Adjaye, Paul Burke, Nelson Perera, Carl Sherwood, Saleh A. Wasimi
