

The table summarises the unit sales and prices for a food manufacturer from 2017 to 2020. Using
Question:
The table summarises the unit sales and prices for a food manufacturer from 2017 to 2020.
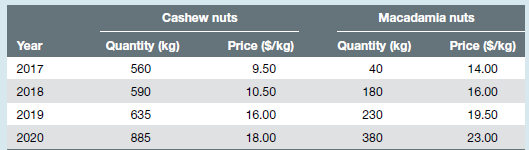
Using 2017 as the base year, construct an unweighted price index, a Laspeyres index and a Paasche index. Interpret each index and explain any differences that you find in your results.
Fantastic news! We've Found the answer you've been seeking!
Step by Step Answer:
Cashew nuts Macadamia nuts Period Quantity kg Price kg Quantity kg Price kg Unweight aggregate price ...View the full answer

Answered By
Vikash Gupta
I am graduated in Physics in 2018, from KIRORIMAL COLLEGE, University of Delhi. Now I am persuing Master's degree in physics. I like to do physics problems. I have experience of 1 year in tutoring. I think Physics is the only subject where you understand things,how they are happening . In physics you learn Maths and apply it. So I would like to join your platform to solve many Physics problems.
5+ Reviews
10+ Question Solved
Related Book For 
Business Analytics And Statistics
ISBN: 9780730363330
1st Edition
Authors: Ken Black, John Asafu Adjaye, Paul Burke, Nelson Perera, Carl Sherwood, Saleh A. Wasimi
Question Posted:
