

Question: When developing a regression model to predict a dependent variable y, it is best, if there are enough data, to build the model using one
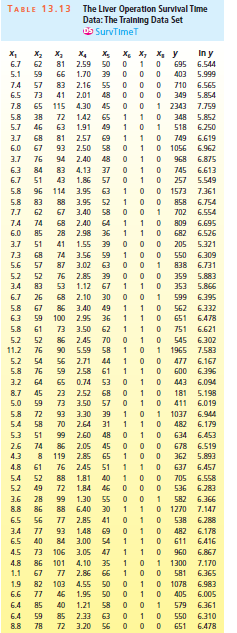
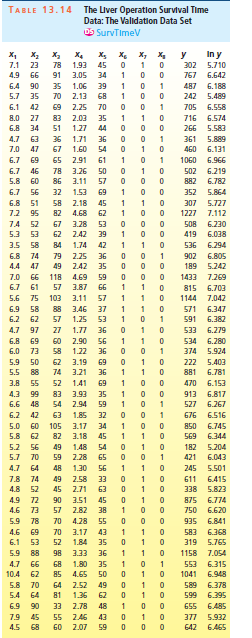
TABLE 13.13 The Liver Operation Survival Time Data: The Tralning Data Set OS SurvTimet In y 6.544 , , X4 . 2.59 , , , 6.7 62 81 50 695 5.1 59 66 1.70 39 403 5.999 7.4 57 83 2.16 55 710 6.565 6.5 73 41 2.01 48 349 5.854 7.8 65 115 4.30 45 2343 7.759 5.8 38 72 1.42 65 348 5.852 5.7 46 63 1.91 49 518 6.250 3.7 68 81 2.57 69 749 6.619 O 1056 2.50 6.0 67 93 58 6.962 3.7 76 94 2.40 48 968 6.875 6.3 84 83 4.13 37 745 6.613 5.549 6.7 51 43 1.86 57 257 5.8 96 114 3.95 63 1573 7.361 5.8 83 88 3.95 52 858 6.754 3.40 7.7 62 67 58 702 6.554 7.4 74 68 2.40 64 809 6.695 6.0 85 28 2.98 36 682 6.526 3.7 51 41 1.55 39 205 5.321 7.3 68 74 3.56 59 550 6.309 5.6 57 87 3.02 63 838 6.731 5.2 52 76 2.85 39 359 5.883 1.12 3.4 83 53 67 353 5.866 6.7 26 68 2.10 30 599 6.395 5.8 67 86 3.40 49 562 6.332 6.3 59 100 2.95 36 651 6.478 5.8 61 73 3.50 62 751 6.621 5.2 52 86 2.45 70 545 6.302 11.2 5.59 1 1965 76 90 58 7.583 5.2 54 56 2.71 44 477 6.167 5.8 76 59 2.58 61 600 6.396 0.74 6.094 3.2 64 65 53 443 8.7 45 23 2.52 68 181 5.198 5.0 59 73 3.50 57 411 6.019 OE'E 39 31 1037 5.8 72 93 6.944 5.4 58 70 2.64 482 6.179 5.3 51 99 2.60 48 634 6.453 2.6 74 86 2.05 45 678 6.519 4.3 119 2.85 65 362 5.893 4.8 61 76 2.45 51 637 6.457 5.4 52 88 1.81 40 705 6.558 6.283 5.2 49 72 1.84 46 536 3.6 28 99 1.30 55 582 6.366 8.8 86 88 6.40 30 1270 7.147 6.5 56 77 2.85 41 538 6.288 3.4 77 93 1.48 69 482 6.178 6.5 40 84 3.00 54 611 6.416 6.867 4.5 73 106 3.05 47 960 1 1300 4.8 86 101 4.10 35 7.170 1.1 67 77 2.86 66 581 6.365 4.55 1.9 82 103 50 1078 6.983 6.6 77 46 1.95 50 405 6.005 6.4 85 40 1.21 58 579 6.361 2.33 6.4 59 85 63 550 6.310 8.8 78 72 3.20 56 651 6.478 TABLE 13.14 The Liver Operation Survival Time Data: The Validatilon Data Set OS SurvTimeV In y , 7.1 , . , , , y 23 78 1.93 45 302 5.710 4.9 66 91 3.05 34 767 6.642 6.4 90 35 1.06 39 487 6.188 5.7 35 70 2.13 68 242 5.489 6.1 42 69 2.25 70 705 6.558 8.0 27 83 2.03 127 35 716 6.574 6.8 34 51 44 266 5.583 4.7 63 36 1.71 36 361 5.889 7.0 47 67 1.60 54 460 6.131 6.7 69 65 2.91 61 1060 6.966 6.7 46 78 3.26 50 502 6.219 5.8 60 86 3.11 57 882 6.782 6.7 56 32 1.53 69 352 5.864 6.8 51 58 2.18 45 307 5.727 7.2 95 82 4.68 62 1227 7.112 7.4 52 67 3.28 53 S08 6.230 5.3 53 62 242 39 419 6.038 3.5 58 84 1.74 42 536 6.294 6.8 74 79 2.25 36 902 6.805 4.4 47 49 2.42 35 189 5.242 7.0 118 4.69 59 1433 7.269 6.7 61 57 3.87 66 815 6.703 5.6 75 103 3.11 57 1144 7.042 6.9 58 88 3.46 37 571 6.347 6.2 62 57 1.25 53 591 6.382 4.7 97 27 1.77 36 $33 6.279 6.8 69 60 2.90 56 534 6.280 6.0 73 58 1.22 36 374 5.924 5.9 50 62 3.19 69 222 5.403 5.5 88 74 3.21 36 881 6.781 3.8 55 52 1.41 69 470 6.153 4.3 99 83 3.93 35 913 6.817 6.6 48 54 2.94 59 527 6.267 6.2 42 63 1.85 32 676 6.516 5.0 60 105 3.17 34 850 6.745 5.8 62 82 3.18 45 569 6.344 5.2 56 49 1.48 54 182 5.204 5.7 70 59 2.28 65 421 6.043 4.7 64 48 1.30 56 245 5.501 7.8 74 49 2.58 33 611 6.415 4.8 52 45 2.71 63 338 5.823 4.9 72 90 3.51 45 875 6.774 4.6 73 2.82 38 750 6.620 5.9 78 70 4.28 55 935 6.841 4.6 69 70 3.17 43 583 6.368 6.1 1.84 35 319 5.765 5.9 88 98 3.33 36 1158 7.054 4.7 66 68 1.80 35 553 6.315 10.4 62 4.65 50 1041 6.948 5.8 70 64 2.52 49 589 6.378 5.4 64 81 1.36 62 599 6.395 6.9 90 33 2.78 48 655 6.485 7.9 45 55 2.46 43 377 5.932 4.5 68 60 2.07 59 642 6.465
Step by Step Solution
3.52 Rating (172 Votes )
There are 3 Steps involved in it
1 y versus x 1 x 2 ... View full answer

Get step-by-step solutions from verified subject matter experts