

Question: The scatterplot shown below displays the 2013 Minnesota State Fair daily attendance (Y) and the daily high temperature (X) for each of the 12 days
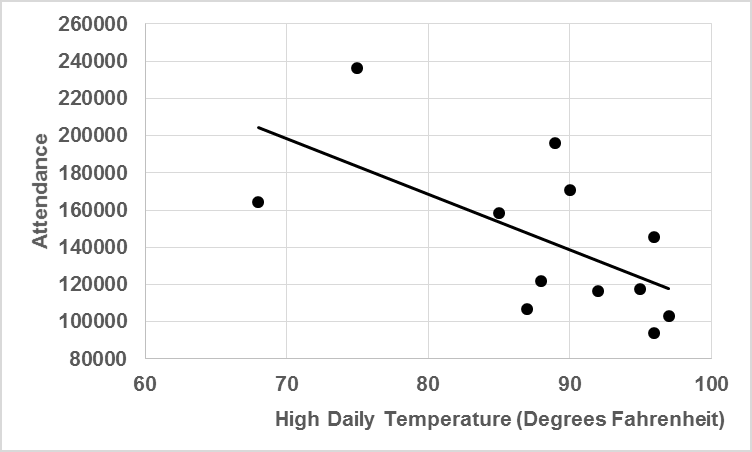
a. For these data, r2 equals .38. Calculate r. (Pay careful attention to the nature of the relationship between temperature and attendance.)
b. According to Cohen€™s guidelines, is the relationship between the high daily temperature weak, moderate, or strong?
c. Two data points in the scatterplot that are associated with the two lowest temperatures appear to be associated with fairly large prediction error. The coordinates of the two data points are (75, 236197) and (68, 164277). What might be a possible explanation for the relatively large prediction errors?
260000 240000 220000 200000 180000 160000 140000 120000 100000 80000 60 70 80 90 100 High Daily Temperature (Degrees Fahrenheit) Attendance
Step by Step Solution
3.34 Rating (163 Votes )
There are 3 Steps involved in it
a The square root of 38 is either 62 or 62 In this case r equal... View full answer

Get step-by-step solutions from verified subject matter experts