

The table shows the numbers (in millions) of single women (never married) and married women m in
Question:
The table shows the numbers (in millions) of single women (never married) and married women m in the civilian work force in the United States for the years 2003 through 2010.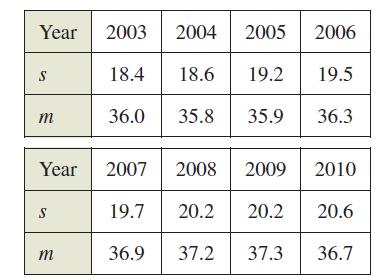
(a) Use the regression capabilities of a graphing utility to find a model of the form m(s) = as3 + bs² + cs + d for the data, where t is the time in years, with t = 3 corresponding to 2003.
(b) Find dm/dt. Then use the model to estimate dm/dt for
t = 7 when it is predicted that the number of single
women in the work force will increase at the rate of 0.75
million per year.
Fantastic news! We've Found the answer you've been seeking!
Step by Step Answer:
a Using a grap...View the full answer

Answered By
Elias Gichuru
am devoted to my work and dedicated in helping my clients accomplish their goals and objectives,providing the best for all tasks assigned to me as a freelancer,providing high quality work that yields high scores.promise to serve them earnestly and help them achieve their goals.i have the needed expertise,knowledge and experience to handle their tasks.
325+ Reviews
859+ Question Solved
Related Book For 

Question Posted:
