

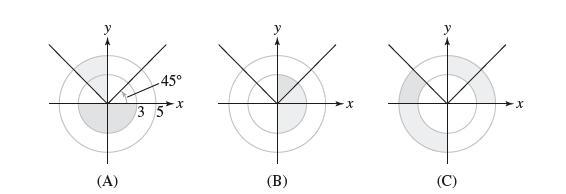
Describe each green shaded sector in Figure 18 by inequalities in r and . (A) -45 35
Question:
Describe each green shaded sector in Figure 18 by inequalities in r and θ.
Fantastic news! We've Found the answer you've been seeking!
Step by Step Answer:
a In the sector shown r is ...View the full answer

Answered By
CHARLES AMBILA
I am an experienced tutor with more than 7 years of experience. I have helped thousands of students pursue their academic goals. My primary objective as a tutor is to ensure that students have easy time handling their academic tasks.
109+ Reviews
323+ Question Solved
Related Book For 

Question Posted:
