

Question: In Exercises let x = 0 represent 1990, x = 1 represent 1991, and so forth. (a) Find a natural logarithm regression equation for the
In Exercises let x = 0 represent 1990, x = 1 represent 1991, and so forth.
(a) Find a natural logarithm regression equation for the data in Table 1.16 and superimpose its graph on a scatter plot of the data.
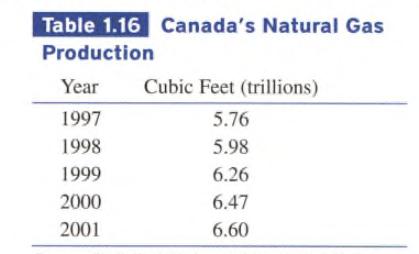
(b) Estimate the number of cubic feet of natural gas produced by Canada in 2002. Compare with the actual amount of 6.63 trillion cubic feet in 2002.
(c) Predict when Canadian natural gas production will reach 7 trillion cubic feet.
Table 1.16 Canada's Natural Gas Production Year Cubic Feet (trillions) 1997 5.76 1998 5.98 1999 6.26 2000 6.47 2001 6.60
Step by Step Solution
3.41 Rating (167 Votes )
There are 3 Steps involved in it
a To find a natural logarithm regression equation we first need to take the natural logarithm of the ... View full answer

Get step-by-step solutions from verified subject matter experts