

A biologist studying a bacterial colony measures its population each hour and records these data: a. Plot
Question:
A biologist studying a bacterial colony measures its population each hour and records these data:
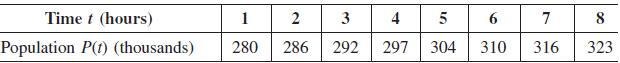
a. Plot these data on a graph. Does the scatter diagram suggest that the population growth is linear or exponential?
b. If you think the scatter diagram in part (a) suggests linear growth, find a population function of the form P(t) = mt + b that best fits the data. However, if you think the scatter diagram suggests exponential growth, modify the least-squares procedure, as illustrated in Example 7.4.4, to obtain a best-fitting population function of the form P(t) = Aekt.
c. Use the population function you obtained in part (b) to predict how long it will take for the population to reach 400,000. How long will it take for the population to double from 280,000?
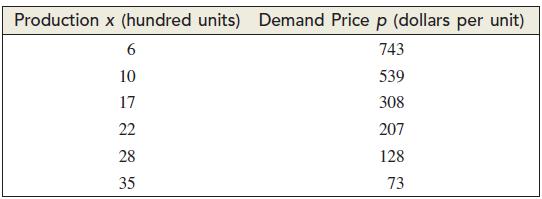
Data from Example 7.4.4.
A manufacturer gathers these data relating the level of production x (hundred units) of a particular commodity to the demand price p (dollars per unit) at which all x units will be sold:
Step by Step Answer:
a The scatter diagram suggests that growth is linear b For this data n 8 T...View the full answer


Calculus For Business, Economics And The Social And Life Sciences
ISBN: 9780073532387
11th Brief Edition
Authors: Laurence Hoffmann, Gerald Bradley, David Sobecki, Michael Price
