

Question: In the solution to Example 1.3.8, we noted that the line that best fits the unemployment data in the example in the sense of least-squares
In the solution to Example 1.3.8, we noted that the line that best fits the unemployment data in the example in the sense of least-squares approximation has the equation y = −0.389x + 7.338. The data in the example stop at the year 2000. The accompanying table gives the unemployment data for the years 2001 through 2009.
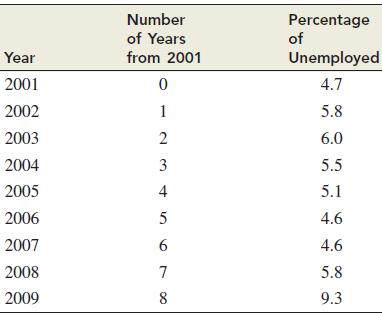
a. Plot the data in the table in a coordinate plane. Then apply the calculator instructions in the Explore! box on page 39 to show that the line that best fits these data in the sense of least-squares approximation has the equation y = 0.245x + 4.731.
b. Interpret the slope of the line in part (a) in terms of the rate of unemployment.
Data from Example 1.3.8.
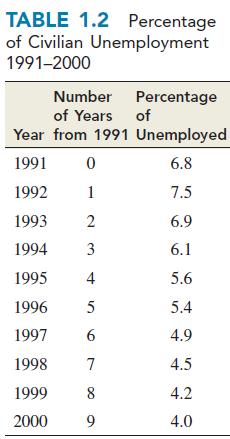
Table 1.2 lists the percentage of the labor force that was unemployed during the decade 1991–2000. Plot a graph with time (years after 1991) on the x axis and percentage of unemployment on the y axis. Do the points follow a clear pattern? Based on these data, what would you expect the percentage of unemployment to be in the year 2005?
Year 2001 2002 2003 2004 2005 2006 2007 2008 2009 Number of Years from 2001 0 1 2 3 4 5 6 7 8 Percentage Unemployed 4.7 5.8 6.0 5.5 5.1 4.6 4.6 5.8 9.3 of
Step by Step Solution
3.43 Rating (166 Votes )
There are 3 Steps involved in it
a b According to the regress... View full answer

Get step-by-step solutions from verified subject matter experts