

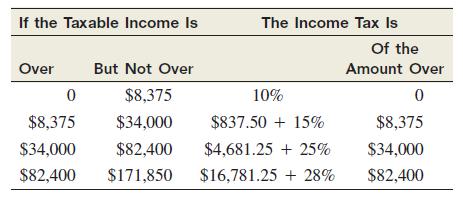
The accompanying table expresses the 2010 federal income tax rate schedule for single taxpayers. a. Express an
Question:
The accompanying table expresses the 2010 federal income tax rate schedule for single taxpayers.
a. Express an individual’s income tax as a function of the taxable income x for 0 ≤ x ≤ 171,850, and draw the graph.
b. The graph in part (a) should consist of four line segments. Compute the slope of each segment. What happens to these slopes as the taxable income increases? Interpret the slopes in practical terms.
Fantastic news! We've Found the answer you've been seeking!
Step by Step Answer:
a b The slopes of the segments are 01 015 025 and 028 respectively As taxable in...View the full answer

Answered By
Muhammad Umair
I have done job as Embedded System Engineer for just four months but after it i have decided to open my own lab and to work on projects that i can launch my own product in market. I work on different softwares like Proteus, Mikroc to program Embedded Systems. My basic work is on Embedded Systems. I have skills in Autocad, Proteus, C++, C programming and i love to share these skills to other to enhance my knowledge too.
1+ Reviews
10+ Question Solved
Related Book For 

Calculus For Business, Economics And The Social And Life Sciences
ISBN: 9780073532387
11th Brief Edition
Authors: Laurence Hoffmann, Gerald Bradley, David Sobecki, Michael Price
Question Posted:
