

The accompanying table gives the number of reported deaths due to AIDS, during the t th year
Question:
The accompanying table gives the number of reported deaths due to AIDS, during the t th year after 1995, for the period 1995 to 2006. (Source: Centers for Disease Control and Prevention, National Center for HIV, STD, and TB Prevention.)

However, the table does not tell the complete story because many deaths actually due to AIDS go unreported or are attributed to other causes. Let D(t) be the function that gives the cumulative number of AIDS deaths at time t. Then the data in the table can be thought of as rates of change of D(t) at various times, that is, as mortality rates. For instance, the table tells us that in 1997 (t = 2), AIDS deaths were increasing at the rate of 22,245 per year.
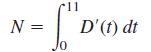
a. Assuming that D(t) is differentiable, explain why the total number of AIDSdeaths N during the period 1995–2006 is given by the integral
b. Estimate N by using the data in the table together with the trapezoidal rule to approximate the integral in part (a).
Step by Step Answer:
a This is the difference ...View the full answer


Calculus For Business, Economics And The Social And Life Sciences
ISBN: 9780073532387
11th Brief Edition
Authors: Laurence Hoffmann, Gerald Bradley, David Sobecki, Michael Price
