

The following figure shows survival curves (percent surviving as a function of age) for people in the
Question:
The following figure shows survival curves (percent surviving as a function of age) for people in the United States in 1900 and 2000. Let ƒ(x, y) give the proportion surviving at age x in year y. Use the graph to estimate the following. Interpret each answer in words.
(a) ƒ(60, 1900)
(b) ƒ(70, 2000)
(c) ƒx(60, 1900)
(d) ƒx(70, 2000)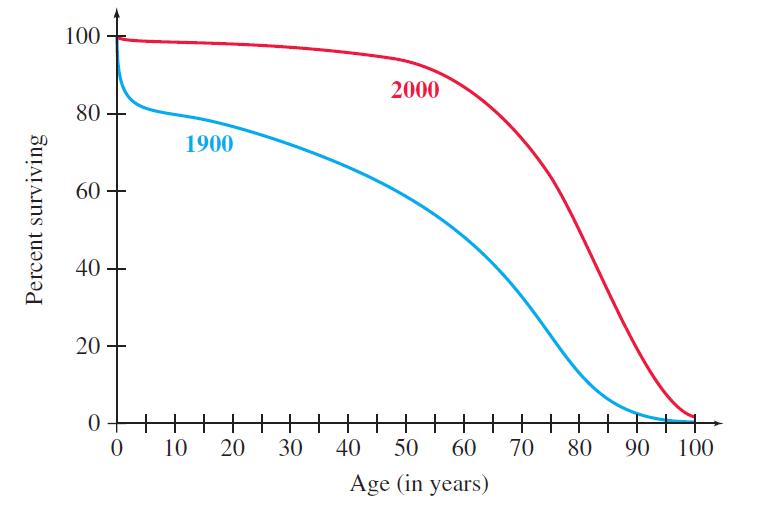
Fantastic news! We've Found the answer you've been seeking!
Step by Step Answer:
a f601900 50 In 1900 50 of those born 60 years earlier are still alive b f702000 75 In 200...View the full answer

Answered By
PALASH JHANWAR
I am a Chartered Accountant with AIR 45 in CA - IPCC. I am a Merit Holder ( B.Com ). The following is my educational details.
PLEASE ACCESS MY RESUME FROM THE FOLLOWING LINK: https://drive.google.com/file/d/1hYR1uch-ff6MRC_cDB07K6VqY9kQ3SFL/view?usp=sharing
3+ Reviews
10+ Question Solved
Related Book For 

Question Posted:
