

Question: Figure Q26.2 shows the electric potential as a function of x. Draw a graph of E x versus x in this same region of space.
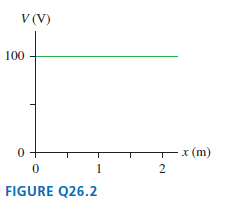
V (V) 100 x (m) FIGURE Q26.2
Step by Step Solution
★★★★★
3.36 Rating (177 Votes )
There are 3 Steps involved in it
1 Expert Approved Answer
Step: 1 Unlock

The electric field is the n... View full answer
Question Has Been Solved by an Expert!
Get step-by-step solutions from verified subject matter experts
Step: 2 Unlock
Step: 3 Unlock
Document Format (2 attachments)
1442_6054778bb8b79_694336.pdf
180 KBs PDF File
1442_6054778bb8b79_694336.docx
120 KBs Word File