

The number of cases of measles in the United States for recent years is shown in the
Question:
The number of cases of measles in the United States for recent years is shown in the graph at the top of the next column. Find the average rate of change per year for each of the following time periods.
(a) 2010 to 2014
(b) 2014 to 2017
(c) 2010 to 2019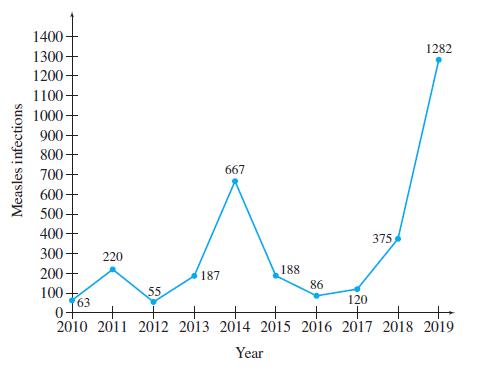
Fantastic news! We've Found the answer you've been seeking!
Step by Step Answer:
a 2010 to 2014 Increase by 151 ca...View the full answer

Answered By
Joseph Ogoma
I have been working as a tutor for the last five years. I always help students to learn and understand concepts that appears challenging to them. I am always available 24/7 and I am a flexible person with the ability to handle a wide range of subjects.
1+ Reviews
10+ Question Solved
Related Book For 

Question Posted:
