

Question: The table lists the average monthly temperatures in Vancouver, Canada These average temperatures cycle yearly and change only slightly over many years. Because of the
The table lists the average monthly temperatures in Vancouver, Canada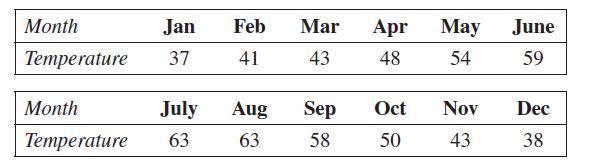
These average temperatures cycle yearly and change only slightly over many years. Because of the repetitive nature of temperatures from year to year, they can be modeled with a sine function. Some graphing calculators have a sine regression feature. If the table is entered into a calculator, the points can be plotted automatically, as shown in the early chapters of this book with other types of functions.
(a) Use a graphing calculator to plot the ordered pairs (month, temperature) in the interval [0, 12] by [30, 70].
(b) Use a graphing calculator with a sine regression feature to find an equation of the sine function that models these data.
(c) Graph the equation from part (b).
(d) Calculate the period for the function found in part (b). What would you expect the period to be? Discuss possible reasons for any discrepancy.
Month Temperature Jan Feb Mar Apr May June 37 41 43 48 54 59 Month Temperature 63 July Aug Sep 63 58 Oct 50 Nov 43 Dec 38
Step by Step Solution
3.41 Rating (151 Votes )
There are 3 Steps involved in it
a Enter the data into a graphing calculator and plot b Use ... View full answer

Get step-by-step solutions from verified subject matter experts