

The table on the next page shows the amount of property damage (in dollars) due to automobile
Question:
The table on the next page shows the amount of property damage (in dollars) due to automobile accidents in California in recent years. In this exercise we are interested in the total amount of property damage due to automobile accidents over the 8-year period from mid-2000 to mid- 2008, using the data for the 9 years.
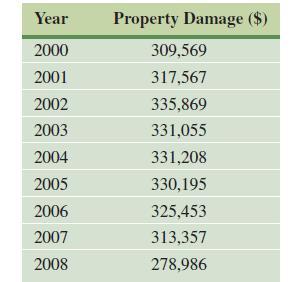
a. One approach is to sum up the numbers in the second column, but only count half of the first and last numbers. Give the answer to this calculation.
b. Approximate the amount of property damage over the 8-year period 2000–2008 by taking the average of the left endpoint sum and the right endpoint sum. Explain why this is equivalent to the calculation done in part a.
c. Explain why the answer from part a is the same as using the trapezoidal rule to approximate the amount of property damage over the 8-year period 2000–2008.
d. Find the equation of the least squares line for this data, letting x = 0 correspond to 2000. Then integrate this equation over the interval [0, 8] to estimate the amount of property damage over this time period. Compare with your answer to part a.
Step by Step Answer:
a The sum of the numbers in the second column but only counting half of the first and last numbers i...View the full answer


Calculus With Applications
ISBN: 9780321831101
10th Edition
Authors: Margaret L Lial, Raymond N Greenwell, Nathan P Ritchey
