

When a hardy new species is introduced into an area, the population often increases as shown in
Question:
When a hardy new species is introduced into an area, the population often increases as shown in the graph in the next column. Explain the significance of the following function values on the graph.
(a) f0
(b) ƒ(a)
(c) fM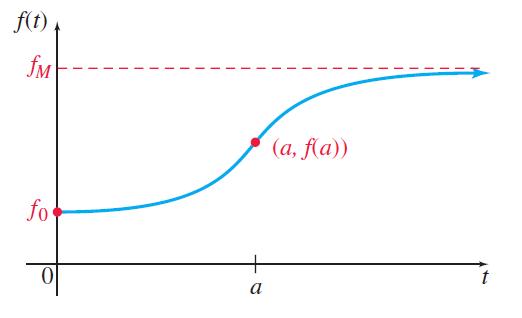
Fantastic news! We've Found the answer you've been seeking!
Step by Step Answer:
a f 0 represents initial popula...View the full answer

Answered By
Kennedy Odhiambo
As a professional writer, I have been in the field for over 5 years having worked as a lecture in different tertiary institutions across the world. With this impeccable experience, I assure provision of a good and supporting environment for students to learn.
2+ Reviews
10+ Question Solved
Related Book For 

Question Posted:
