

The sketch graph shows the curve of y = 5x x 2 . The marked point, P,
Question:
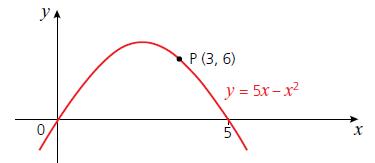
The sketch graph shows the curve of y = 5x− x2. The marked point, P, has coordinates (3, 6).
Find:
a. The gradient function dy/dx
b. The gradient of the curve at P
c. The equation of the tangent at P
d. The equation of the normal at P.
Fantastic news! We've Found the answer you've been seeking!
Step by Step Answer:
a To find the gradient function we need to differentiate y with respect to x d...View the full answer

Answered By
Darwin Romero
I use a hands-on technique and am approachable to my students. I incorporate fun into my lessons when possible. And while my easy-going style is suitable for many subjects and grades, I am also able to adapt my style to the needs of the student. I can describe myself as friendly, enthusiastic and respectful. As a teacher, we can easily get respect from the students if they would feel respected first
0 Reviews
10+ Question Solved
Related Book For 
Cambridge IGCSE And O Level Additional Mathematics
ISBN: 9781510421646
1st Edition
Authors: Val Hanrahan, Jeanette Powell
Question Posted:
