

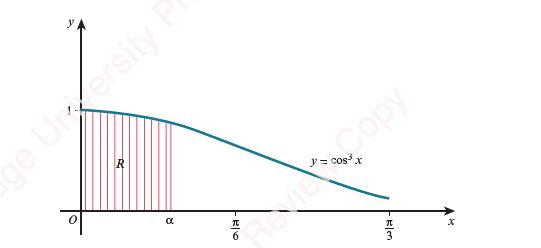
The diagram shows part of the curve y = cos 3 x, where x is in radians.
Question:
The diagram shows part of the curve y = cos3 x, where x is in radians. The shaded region between the curve, the axes and the line x = α is denoted by R. The area of R is equal to 0.3.
a. Using the substitution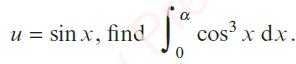
Hence show that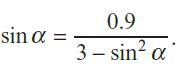
b. Use the iterative formula
with α1 = 0.2, to find the value of α correct to 3 significant figures. Give the result of each iteration to 5 significant figures.
Fantastic news! We've Found the answer you've been seeking!
Step by Step Answer:
a To find cos x dx using the substitution sin x we first need to ex...View the full answer

Answered By
Churchil Mino
I have been a tutor for 2 years and have experience working with students of all ages and abilities. I am comfortable working with students one-on-one or in small groups, and am able to adapt my teaching style to meet the needs of each individual. I am patient and supportive, and my goal is to help my students succeed.
I have a strong background in math and science, and have tutored students in these subjects at all levels, from elementary school to college. I have also helped students prepare for standardized tests such as the SAT and ACT. In addition to academic tutoring, I have also worked as a swim coach and a camp counselor, and have experience working with children with special needs.
0 Reviews
10+ Question Solved
Related Book For 
Cambridge International AS & A Level Mathematics Pure Mathematics 2 & 3 Coursebook
ISBN: 9781108407199
1st Edition
Authors: Sue Pemberton, Julianne Hughes, Julian Gilbey
Question Posted:
