

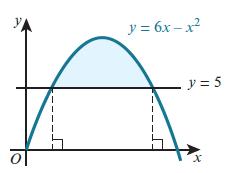
The diagram shows the curve y = 6x x 2 and the line y = 5.
Question:
The diagram shows the curve y = 6x − x2 and the line y = 5. Find the area of the shaded region.
Fantastic news! We've Found the answer you've been seeking!
Step by Step Answer:
First we need to find the xcoordinates of the points where the curve and the line intersect To do th...View the full answer

Answered By
Rina May Lopez
Am competent enough since I have two years experience in tutoring
0 Reviews
10+ Question Solved
Related Book For 
Cambridge International AS And A Level Mathematics Pure Mathematics 1 Coursebook
ISBN: 9781108407144
1st Edition
Authors: Sue Pemberton, Julian Gilbey
Question Posted:
