

The graph below shows the relationship between rate of transpiration and rate of water uptake for a
Question:
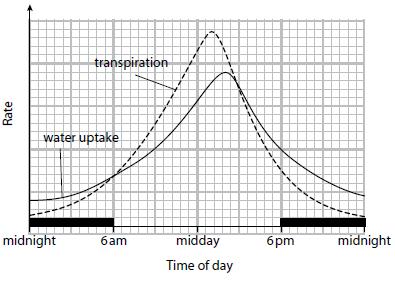
The graph below shows the relationship between rate of transpiration and rate of water uptake for a particular plant.
a. Define the term transpiration.
b. State the two environmental factors which are most likely to be responsible for the changes in transpiration rate shown in the graph above.
c. Describe the relationship between rate of transpiration and rate of water uptake shown in the graph above.
d. Explain the relationship.
Fantastic news! We've Found the answer you've been seeking!
Step by Step Answer:
a ans Transpiration is the loss of water from a plant in the form of water vapour Water is absorbed ...View the full answer

Related Book For 

Cambridge International AS And A Level Biology
ISBN: 9781107636828
4th Edition
Authors: Mary Jones, Richard Fosbery, Jennifer Gregory, Dennis Taylor
Question Posted:
