

Question: The graph below shows the relationship between cost, revenue, and profit, in millions of dollars, for making and selling x million video games. 280
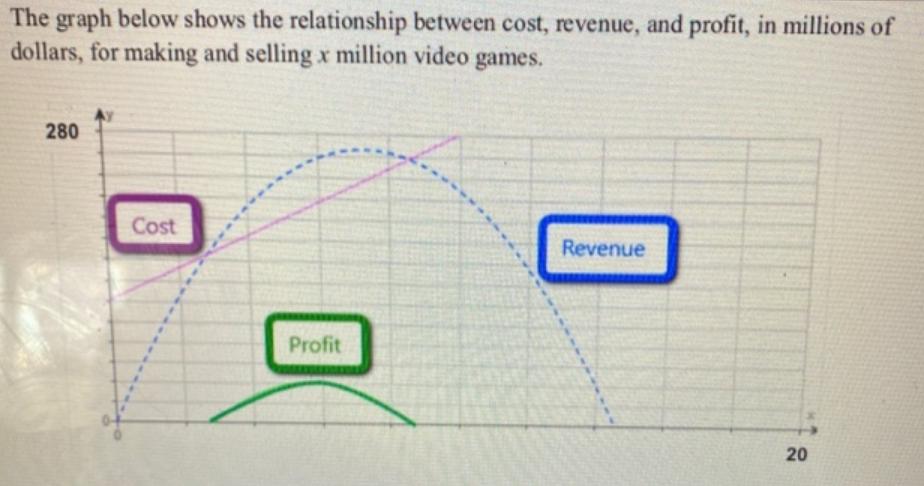
The graph below shows the relationship between cost, revenue, and profit, in millions of dollars, for making and selling x million video games. 280 Cost Revenue Profit 20 a) Estimate the break-even points and explain what they mean in the context of the problem. Round to the nearest tenth. Pay attention to labels/units! b) Estimate how many video games must be made and sold to reach maximum profit and also report what that profit is. Round to the nearest tenth. Pay attention to labels/units!
Step by Step Solution
There are 3 Steps involved in it
1 Expert Approved Answer
Step: 1 Unlock

Question Has Been Solved by an Expert!
Get step-by-step solutions from verified subject matter experts
Step: 2 Unlock
Step: 3 Unlock