

Question: Analyze Table 11.9 using a transitional model with two previous responses. Does it fit better than the first-order model of Section 11.5.5? Interpret. Section 11.5.5:
Analyze Table 11.9 using a transitional model with two previous responses. Does it fit better than the first-order model of Section 11.5.5? Interpret.
Section 11.5.5:
Table 11.9 is also from the Harvard study of air pollution and health. At ages 7 through 10, children were evaluated annually on the presence of respiratory illness. A predictor is maternal smoking at the start of the study, where s = 1 for smoking regularly and s = 0 otherwise. Let yt denote the response at age t (t = 7, 8, 9, 10). We consider the regressive logistic model

Each subject contributes three observations to the model fitting. The data set consists of 12 binomials, for the 2 × 3 × 2 combinations of (s, t, yt−1). For instance, for the combination (0, 8, 0), y8 = 0 for 237 + 10 + 15 + 4 =
Table 11.9:
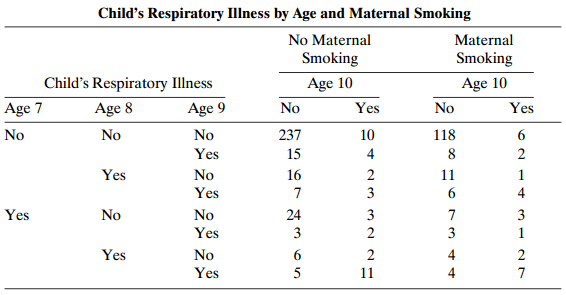
266 subjects and y8 = 1 for 16 + 2 + 7 + 3 = 28 subjects. The ML fit is

with SE values (0.846, 0.156, 0.095, 0.158). Not surprisingly, the previous observation has a strong effect. Given that and the child’s age, there is slight evidence of a positive effect of maternal smoking: The likelihood-ratio statistic for Hu: β1 = 0 is 3.55 (df = 1, P = 0.06 . The model itself does not show any evidence of lack of fit (G2 = 3.1, df = 8).
Step by Step Solution
3.44 Rating (163 Votes )
There are 3 Steps involved in it

Get step-by-step solutions from verified subject matter experts