

Question: Fit a model with complementary log-log link to Table 7.20, which shows family income distributions by percent for families in the north east U.S. Interpret
Fit a model with complementary log-log link to Table 7.20, which shows family income distributions by percent for families in the north east U.S. Interpret the difference between the income distributions.
Table 7.20:
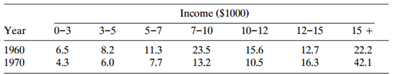
Income ($1000) 0-3 5-7 7-10 12-15 3-5 10-12 15 + Year 1960 1970 23.5 13.2 22.2 42.1 6.5 4.3 8.2 6.0 11.3 7.7 15.6 10.5 12.7 16.3
Step by Step Solution
★★★★★
3.45 Rating (155 Votes )
There are 3 Steps involved in it
1 Expert Approved Answer
Step: 1 Unlock

To fit a complementary loglog model to the income data in Table 720 we first need ... View full answer
Question Has Been Solved by an Expert!
Get step-by-step solutions from verified subject matter experts
Step: 2 Unlock
Step: 3 Unlock