

Question: Refer to Problem 5.1. Table 6.18 shows output for fitting a probit model. Interpret the parameter estimates (a) using characteristics of the normal cdf response
Refer to Problem 5.1. Table 6.18 shows output for fitting a probit model. Interpret the parameter estimates (a) using characteristics of the normal cdf response curve, (b) finding the estimated rate of change in the probability of remission where it equals 0.5, and (e) finding the difference between the estimated probabilities of remission at the upper and lower quartiles of the labeling index, 14 and 28.
Table 6.18:
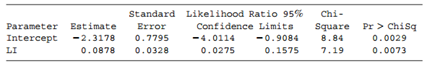
Data from Prob. 5.1:
For a study using logistic regression to determine characteristics associated with remission in cancer patients, Table 5.10 shows the most important explanatory variable, a labeling index (LI). This index measures proliferative activity of cells after a patient receives an injection of tritiated thymidine, representing the percentage of cells that are “labeled.” The response Y measured whether the patient achieved remission (1 = yes). Software reports Table 5.11 for a logistic regression model using LI to predict the probability of remission.
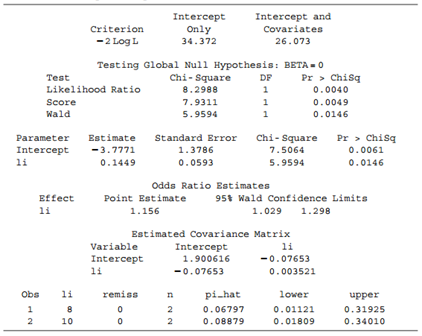
a. Show how software obtained π̂ = 0.068 when LI = 8.
b. Show that π̂ = 0.5 when LI = 26.0.
c. Show that the rate of change in π̂ is 0.009 when LI = 8 and 0.036 when LI = 26.
Data from Table 5.11:
Step by Step Solution
3.38 Rating (176 Votes )
There are 3 Steps involved in it
a x 23178 0878x is the cdf of a normal distribution wi... View full answer

Get step-by-step solutions from verified subject matter experts