

Question: Refer to Table 2.9. Construct and interpret a 95% confidence interval for the population (a) odds ratio, (b) difference of proportions, and (c) relative risk
Refer to Table 2.9. Construct and interpret a 95% confidence interval for the population (a) odds ratio, (b) difference of proportions, and (c) relative risk between seat-belt use and type of injury.
Table 2.9:
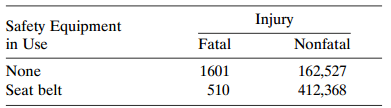
Safety Equipment in Use None Seat belt Injury Nonfatal Fatal 1601 510 162,527 412,368
Step by Step Solution
★★★★★
3.45 Rating (171 Votes )
There are 3 Steps involved in it
1 Expert Approved Answer
Step: 1 Unlock

a To construct a 95 confidence interval for the population odds ratio we need to first calculate the ... View full answer
Question Has Been Solved by an Expert!
Get step-by-step solutions from verified subject matter experts
Step: 2 Unlock
Step: 3 Unlock