

Question: Refer to Table 4.2. Using scores {0, 2, 4, 5) for snoring, fit the logistic regression model. Interpret using fitted probabilities, linear approximations, and effects
Table 4.2:
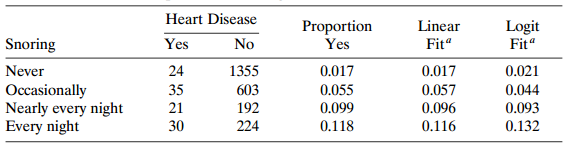
Heart Disease Proportion Yes 0.017 0.055 0.099 0.118 Logit Fit" Linear Fit Yes No Snoring Never Occasionally Nearly every night 1355 603 192 224 0.017 0.057 0.096 0.116 24 35 21 30 0.021 0.044 0.093 0.132 Every night
Step by Step Solution
★★★★★
3.48 Rating (161 Votes )
There are 3 Steps involved in it
1 Expert Approved Answer
Step: 1 Unlock

logit 3866 0397 snoring Fitted probabilities are ... View full answer
Question Has Been Solved by an Expert!
Get step-by-step solutions from verified subject matter experts
Step: 2 Unlock
Step: 3 Unlock