

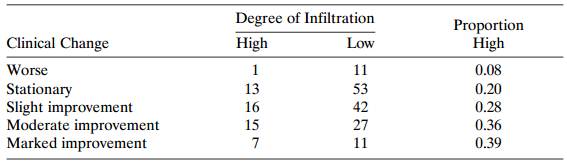
Refer to Table 6.11. The Pearson test of independence has X 2 (I) = 6.88. For equally
Question:
Table 6.11:
Fantastic news! We've Found the answer you've been seeking!
Step by Step Answer:
The CochranArmitage test u...View the full answer

Answered By
Hamza Amjad
Currently I am student in master degree program.from last two year I am tutring in Academy and I tought many O/A level student in home tution.
3+ Reviews
10+ Question Solved
Related Book For 
Question Posted:
