

Question: Standardize Table 10.6. Describe the migration patterns. Table 10.6: Migration from 1980 to 1985, with Fit of Marginal Homogeneity Model Residence in 1985 Residence in
Standardize Table 10.6. Describe the migration patterns.
Table 10.6:
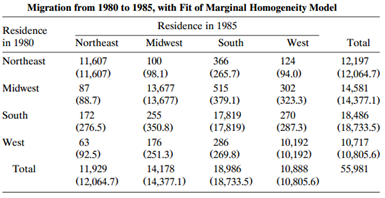
Migration from 1980 to 1985, with Fit of Marginal Homogeneity Model Residence in 1985 Residence in 1980 Northeast Midwest South West Total Northeast 11,607 (11,607) 100 366 124 12,197 (12,064.7) (98.1) (265.7) (94.0) Midwest 87 13,677 (13,677) 515 302 14,581 (14,377.1) (88.7) (379.1) (323.3) South 172 255 17,819 (17,819) 270 18,486 (18,733.5) (276.5) (350.8) (287.3) West 63 176 286 10,192 (10,192) 10,717 (10,805.6) (92.5) (251.3) (269.8) Total 11,929 14,178 18,986 10,888 55,981 (12,064.7) (14,377.1) (18,733.5) (10,805.6)
Step by Step Solution
3.42 Rating (152 Votes )
There are 3 Steps involved in it
Migration from 1980 to 1985 with Fit of Marginal Homogeneity Model Residenc... View full answer

Get step-by-step solutions from verified subject matter experts