

Question: Table 5.16 shows estimated effects for a fitted logistic regression model with squamous cell esophageal cancer (Y = 1, yes; Y = 0, no) as
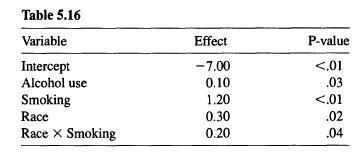
Table 5.16 shows estimated effects for a fitted logistic regression model with squamous cell esophageal cancer (Y = 1, yes; Y = 0, no) as the response variable. Smoking status (S) equals 1 for at least one pack per day and 0 otherwise, alcohol consumption (A) equals the average number of alcoholic drinks consumed per day, and race (R) equals 1 for blacks and O for whites.
a. To describe the race-by-smoking interaction, construct the prediction equa- tion when R 1 and again when R = 0. Find the fitted Y-S conditional odds ratio for each case. Similarly, construct the prediction equation when S = 1 and again when S = 0. Find the fitted Y-R conditional odds ratio for each case. Note that, for each association, the coefficient of the cross-product term is the difference between the log odds ratios at the two fixed levels for the other variable.
b. In Table 5.16, explain what the coefficients of R and S represent, for the coding as given above. What hypotheses do the P-values refer to for these variables?
c. Suppose the model also contained an A-R interaction term, with coefficient 0.04. In the prediction equation, show that this represents the difference between the effect of A for blacks and for whites.
Table 5.16 Variable Effect P-value Intercept -7.00
Step by Step Solution
There are 3 Steps involved in it

Get step-by-step solutions from verified subject matter experts