

Question: Table 5.17 shows estimated effects for a logistic regression model with squamous cell esophageal cancer (Y = 1, yes; Y = 0, no) as the
Table 5.17:
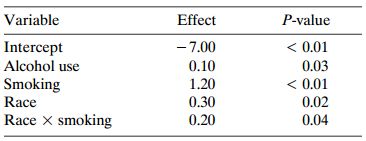
Variable Effect P-value < 0.01 0.03 < 0.01 Intercept Alcohol use Smoking Race Race X smoking - 7.00 0.10 1.20 0.30 0.02 0.20 0.04
Step by Step Solution
★★★★★
3.53 Rating (156 Votes )
There are 3 Steps involved in it
1 Expert Approved Answer
Step: 1 Unlock

R 1 logit 67 1A 14S R 0 logit 70 1A 12 S The YS conditional odds ratio is exp14 41 for blacks and ... View full answer
Question Has Been Solved by an Expert!
Get step-by-step solutions from verified subject matter experts
Step: 2 Unlock
Step: 3 Unlock