

Question: . The following table shows estimated effects for a tted logistic regression model with squamous cell esophageal cancer (Y = 1, yes; Y = 0,
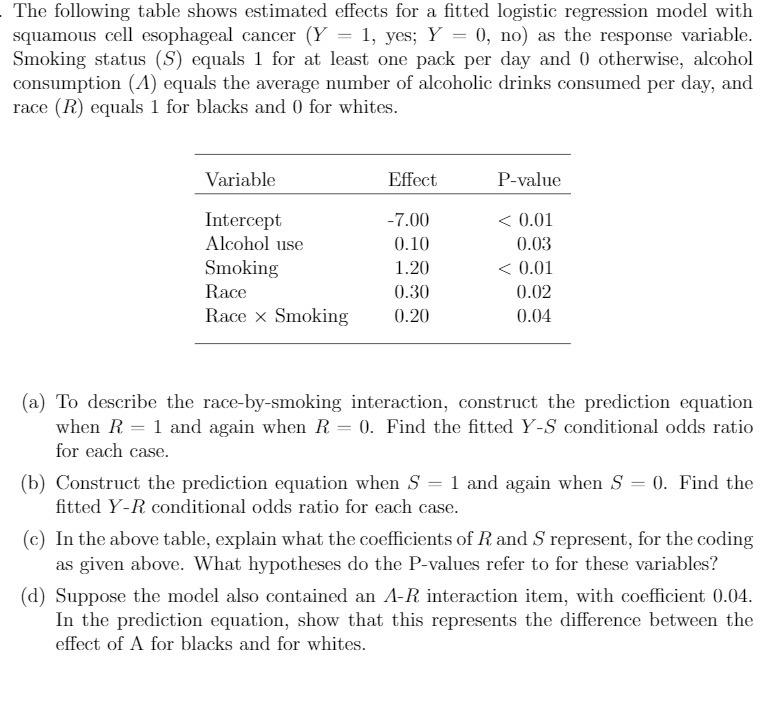
. The following table shows estimated effects for a tted logistic regression model with squamous cell esophageal cancer (Y = 1, yes; Y = 0, no) as the response variable. Smoking status (3} equals 1 for at least one pack per daf,r and 0 otherwise, alcohol consumption (A) equals the average number of alcoholic drinks consumed per day, and race (R) equals 1 for blacks and 0 for whites. Variable Effect Pvalue Intercept 7.00 s\". 0.01 Alcohol use 0.10| 0.03 Smoking 1.20| s\". 001 Race 0.30 0.02 Race X Smoking 0.20| 0.04 (a) To describe the racebvsmoking interaction, construct the prediction equation when R = 1 and again when R = 0. Find the tted YS conditional odds ratio for each case. {b} Construct the prediction equation when S = 1 and again when S = 0. Find the tted YR conditional odds ratio for each case. (c;1 In the above table, explain what the coeicients of R and S represent, for the coding as given above. What hypotheses do the Pvalues refer to for these variables? {d} Suppose the model also contained an 113. interaction item, with coefcient 0.04. In the prediction equation, show that this represents the difference between the effect of A for blacks and for whites
Step by Step Solution
There are 3 Steps involved in it

Get step-by-step solutions from verified subject matter experts