

Question: Table 7.21 shows results of fitting the mean response model to Table 7.8 using scores (3, 10, 20, 35} for income and (1, 3, 4,
Table 7.21 shows results of fitting the mean response model to Table 7.8 using scores (3, 10, 20, 35} for income and (1, 3, 4, 5) for job satisfaction. Interpret the income effect, provide a confidence interval for the difference in mean satisfaction at income levels 35 and 3, controlling for gender, and check the model fit.
Table 7.21:
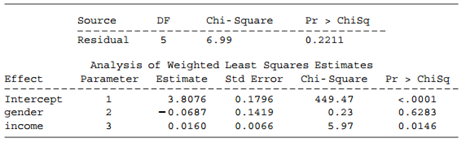
Chi- Square DF Pr > Chisq Source Residual 6.99 0.2211 Analysis of Weighted Least Squares Estimates Parameter Chi- Square Effect Estimate Pr > Chisq
Step by Step Solution
★★★★★
3.48 Rating (168 Votes )
There are 3 Steps involved in it
1 Expert Approved Answer
Step: 1 Unlock

The estimated income effect is 35 30160 51 that is the estima... View full answer
Question Has Been Solved by an Expert!
Get step-by-step solutions from verified subject matter experts
Step: 2 Unlock
Step: 3 Unlock