

Question: Table 9.18 lists total attendance (in thousands) and the total number of arrests in the 1987 1988 season for soccer teams in the Second Division
Table 9.18:
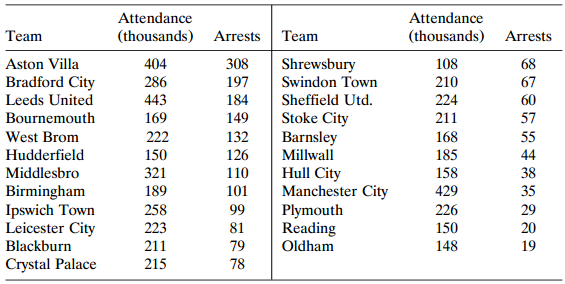
Attendance Attendance (thousands) Arrests Team Team (thousands) Arrests Aston Villa 404 308 Shrewsbury Swindon Town 108 68 Bradford City 286 197 210 67 Leeds United 443 184 Sheffield Utd. Stoke City Barnsley Millwall Hull City Manchester City Plymouth Reading Oldham 224 60 Bournemouth 169 149 211 57 222 132 West Brom 168 55 Hudderfield 150 126 185 44 321 Middlesbro 110 158 38 Birmingham Ipswich Town Leicester City 189 101 429 35 258 99 226 29 223 81 150 20 211 79 19 Blackburn 148 Crystal Palace 215 78
Step by Step Solution
3.44 Rating (160 Votes )
There are 3 Steps involved in it
Model fit is logEYt 910 where the estimate 910 has std ... View full answer

Get step-by-step solutions from verified subject matter experts