

Question: Table 9.19 is based on a study with British doctors. a. For each age, find the sample coronary death rates per 1000 person-years for nonsmokers
a. For each age, find the sample coronary death rates per 1000 person-years for nonsmokers and smokers. To compare them, take their ratio and describe its dependence on age.
b. Fit a main-effects model for the log rates having four parameters for age and one for smoking. In discussing lack of fit, show that this model assumes a constant ratio of nonsmokers€™ to smokers€™ coronary death rates over age.
c. From part (a), explain why it is sensible to add a quantitative interaction of age and smoking. For this model, show that the log ratio of coronary death rates changes linearly with age. Assign scores to age, fit the model, and interpret.
Table 9.19:
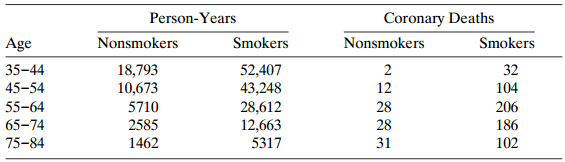
Person-Years Coronary Deaths Age Nonsmokers 18,793 10,673 5710 2585 Smokers Nonsmokers Smokers 2 12 35-44 45-54 55-64 65-74 52,407 43,248 28,612 32 104 206 28 28 12,663 5317 186 102 75-84 1462 31
Step by Step Solution
3.46 Rating (162 Votes )
There are 3 Steps involved in it
a The ratio of the rate for smokers to nonsmokers decreases ... View full answer

Get step-by-step solutions from verified subject matter experts