

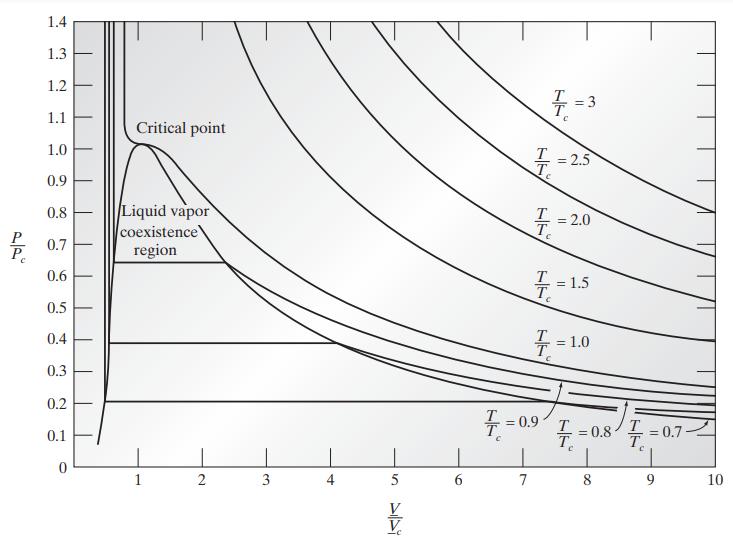
Figure 7.3-4 is the phase diagram for a van der Waals fluid. Within the vapor-liquid coexistence envelope
Question:
Figure 7.3-4 is the phase diagram for a van der Waals fluid. Within the vapor-liquid coexistence envelope one can draw another envelope representing the limits of supercooling of the vapor and superheating of the liquid that can be observed in the laboratory; along each isotherm these are the points for which
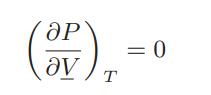
Obtain this envelope for the van der Waals fluid. This is the spinodal curve. The region between the coexistence curve and the curve just obtained is the metastable region of the fluid. Notice also that the critical point of the fluid is metastable.
Figure 7.3-4
Step by Step Answer:

This question has not been answered yet.
You can Ask your question!
Related Book For 
Chemical Biochemical And Engineering Thermodynamics
ISBN: 9780470504796
5th Edition
Authors: Stanley I. Sandler
Question Posted:
