

Within the two-phase envelope, one can draw another envelope representing the limits of supercooling of the vapor
Question:
Within the two-phase envelope, one can draw another envelope representing the limits of supercooling of the vapor and superheating of liquid that can be observed in the laboratory; along each isotherm these are the points for which (∂P/∂ρ)T = 0. Obtain this envelope for the Peng-Robinson equation, and plot it on the same figure as generated in problem 7.12. This is the spinodal curve. The region between the saturation curve and the curve just obtained is called the metastable region of the fluid. Inside the spinodal curve, the fluid is unconditionally unstable. The saturation curve is called the binodal curve. Outside, the fluid is entirely stable. It is possible to enter the metastable region with hot water by heating at atmospheric pressure in a very clean flask. Sooner or later, the superheated liquid becomes unstable, however. Describe what would happen to your flask of hot water under these conditions and a simple precaution that you might take to avoid these consequences.
Data from Problem 7.12
Plot Pr versus ρr for the Peng-Robinson equation with Tr = [0.7,0.9,1.0], showing both vapor and liquid roots in the two-phase region. Assume ω = 0.040 as for N2. Include the entire curve for each isotherm, as illustrated in Fig. 7.1. Also show the horizontal line that connects the vapor and liquid densities at the saturation pressure. Use lines without points for the theoretical curves. Estimate Trsat by log(Prsat) = 2.333(1 + ω) (1 - 1/Trsat).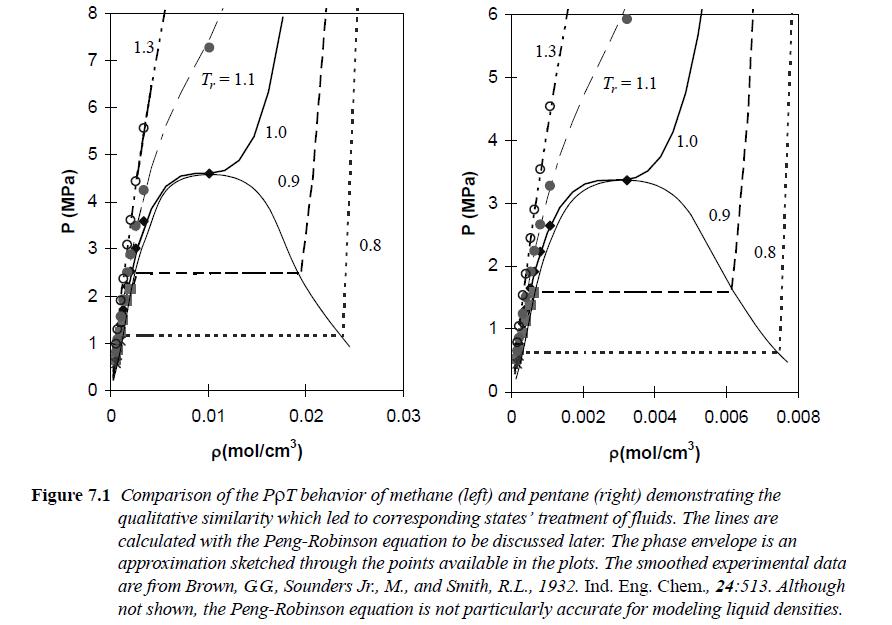
Step by Step Answer:

This question has not been answered yet.
You can Ask your question!

Introductory Chemical Engineering Thermodynamics
ISBN: 9780136068549
2nd Edition
Authors: J. Elliott, Carl Lira
