

The overall goal of this problem is to compute the PV and PT equilibrium diagramsfor a single
Question:
The overall goal of this problem is to compute the P–V and P–T equilibrium diagramsfor a single component fluid described by the van derWaals equation of state. Let us recall the key things we need to know from thermodynamics, following the notation from Sandler’s textbook. The van der Waals equation of state is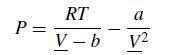
where P is the pressure, R is the ideal gas constant, T is the temperature, V is the molar volume, and a and b are constants. Since we are looking at phenomena that will include supercritical values, it proves convenient to use MPa for the pressure and L/mol for the volume. For this problem, we will consider a fluid with a = 2.5 MPa L2/mol2 and b = 0.2 L/mol. The critical properties of the van der Waals fluid are readily related to these parameters,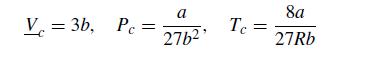
The van der Waals equation of state also has a very nice expression for the departure functions,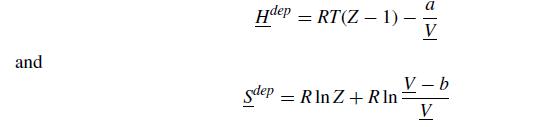
where Z = PV/RT is the compressibility.
(a) We will begin with an easy problem where we have a supercritical fluid with T = 470 K and P = 3 MPa. Have your program use Newton’s method to determine V at these conditions. To help you out, you should first make a plot of the isotherm to get a guess for the answer for V. Print out the plot of the isotherm and include the value of V on your plot. You should also include a brief explanation of your solution method, such as the algorithm for Newton’s method with the relevant equations.
(b) While it is fairly easy to calculate volumes for supercritical fluids, it is harder to calculate the two-phase region. Let us first consider a case where T = 425 K and P = 2 MPa. Have your program make a plot of the isotherm to start so that you can see what it looks like and include it in your written solution. To make a nice plot, use 0.21 ≤ V ≤ 3 and 0 ≤ P ≤ 6 for the boundaries of the plot. We now want to see how the value of the volume in Newton’s method, V(k), depends on the number of iterations k for a given initial guess, V(0). First let’s consider V(0) = 0.23 L/mol, which is an initial guess very close to b. Have your program execute Newton’s method for this initial guess and produce the plot of V(k) vs. k. Which root did you find? Demonstrate that the convergence is quadratic using |f(x)| −8 as the condition.
(c) Now let’s use T = 425 K and P = 2 MPa and consider a really bad guess, V(0) = 0.6. What happened to the evolution of your solution? You should be able to explain this result with a combination of your knowledge of numerical methods and thermodynamics. As we approach the critical point, what happens to the roots? How does this affect your numerical solution?
(d) Now let’s compute an isotherm.We know that in the two phase region, there should be a tie-line connecting the vapor and liquid molar volumes at the saturation pressure, Psat(T), for a given temperature. We will do the isotherm for T = 395 K. An algorithm to find the saturation pressure and the corresponding molar volumes using a departure function approach is:
(1) make an initial guess for Psat
(2) compute the molar volumes of the vapor and liquid at this pressure
(3) Compute Gdep = Gdepliquid− Gdepliquid
(4) If |ΔGdep|
Reformulate this into a Newton’s method algorithm for computing the saturation pressure. Include the details of your calculation in the written assignment, and add the algorithm to your program. Now let’s make the real isotherm. To produce a good initial guess for Psat, you should make a plot of the isotherm from the van der Waals equation of state and find a pressure that looks like it will satisfy the equal area rule (a graphical way to find the saturation pressure). What is your rationale for the initial guess? Your program should then make the plot of the isotherm from the van derWaals equation of state and the real isotherm, which has the tie-line between the two equilibrium conditions. What are the values of the liquid and vapor molar volumes?
(e) You are now in a position to make the P–V and P–T diagrams, since they “only” require computing isotherms for a number of different temperatures. The challenge here is making good guesses, which should be clear from Problem 3.2. The numerical approach is to use a continuation method, where you use the values of Psat, Vliquid, and Vvapor at some value of T to compute the new values of the pressure and volumes at a temperature T = T + ΔT, where T is a small change in temperature. The definition of “small” depends on how quickly things are changing in the numerical solution, so you will need to do some exploration to find good values of ΔT. Your program should generate a the P–V and P–T plots for T = 365 K to T = Tc. Label the regions where you have liquid, vapor, or liquid–vapor equilibrium.
Data from Problem 3.2
For the nonlinear functions that follow, provide the Newton iteration formula that you would use to find the roots of f (x) = 0: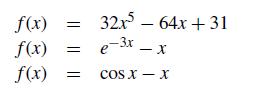
Step by Step Answer:

This question has not been answered yet.
You can Ask your question!

Numerical Methods With Chemical Engineering Applications
ISBN: 9781107135116
1st Edition
Authors: Kevin D. Dorfman, Prodromos Daoutidis
