

Develop plots for vapor pressure of water and n-decane. For water, two plots are useful in the
Question:
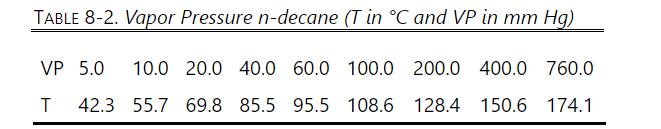
Develop plots for vapor pressure of water and n-decane. For water, two plots are useful in the range of values in Table 8-1. A plot of VP versus T is convenient for rapid estimates but is not as accurate as a plot of log (VP) versus \(1 / \mathrm{T}\) with \(\mathrm{T}\) in degrees Kelvin. Of course, a plot for n-decane would also be useful but will not be used as often as the water data.
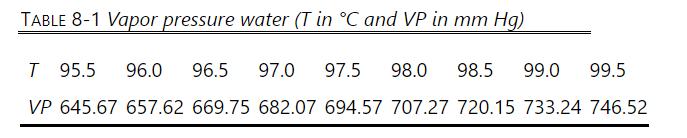
a. Plot water vapor pressure versus \(\mathrm{T}\) on a normal sheet of graph paper.
b. Expand Table 8-1 to include columns for \(\mathrm{T}\) in degrees Kelvin, 1/T \((1 / \mathrm{K})\), and \(\log (\mathrm{VP})\). Then plot \(\log (\mathrm{VP})\) versus \(1 / \mathrm{T}\).

c. Plot n-decane vapor pressure versus \(\mathrm{T}\) on a normal sheet of graph paper. Data are in Table 8-2.
Step by Step Answer:

This question has not been answered yet.
You can Ask your question!

Separation Process Engineering Includes Mass Transfer Analysis
ISBN: 9780137468041
5th Edition
Authors: Phillip Wankat
