

Question: Input the DECHEMA coefficients in Aspen Plus from Table 13-A1 in the appendix. Then in Properties, have Aspen print out the triangular diagram for the
Input the DECHEMA coefficients in Aspen Plus from Table 13-A1 in the appendix. Then in Properties, have Aspen print out the triangular diagram for the triethylamine, carbon-tetrachloride, acetic-acid system. Plot experimental tie lines from Table 13-A1 on this diagram to see how good the fit is.
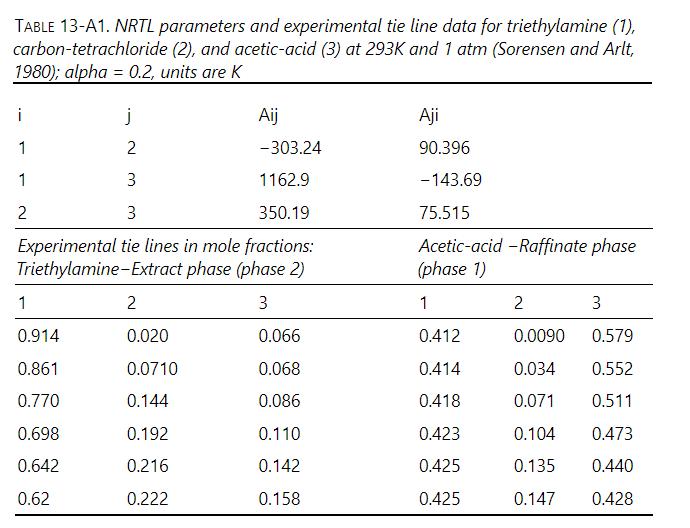
TABLE 13-A1. NRTL parameters and experimental tie line data for triethylamine (1), carbon-tetrachloride (2), and acetic-acid (3) at 293K and 1 atm (Sorensen and Arlt, 1980); alpha = 0.2, units are K i j 1 2 1 3 2 3 Aij Aji -303.24 90.396 1162.9 -143.69 350.19 75.515 Experimental tie lines in mole fractions: Triethylamine-Extract phase (phase 2) Acetic-acid-Raffinate phase (phase 1) 1 2 3 1 2 3 0.914 0.020 0.066 0.412 0.0090 0.579 0.861 0.0710 0.068 0.414 0.034 0.552 0.770 0.144 0.086 0.418 0.071 0.511 0.698 0.192 0.110 0.423 0.104 0.473 0.642 0.216 0.142 0.425 0.135 0.440 0.62 0.222 0.158 0.425 0.147 0.428
Step by Step Solution
3.50 Rating (160 Votes )
There are 3 Steps involved in it

Get step-by-step solutions from verified subject matter experts