

Question: Use Aspen Plus Analysis to develop and print out ternary diagrams for the system water-chloroform-acetone using NRTL as the LLE correlation. Compare results to experimental
Use Aspen Plus Analysis to develop and print out ternary diagrams for the system water-chloroform-acetone using NRTL as the LLE correlation. Compare results to experimental data in Table 13-A2 (mole fractions).
a. Use binary interaction parameters from the Aspen Plus database.
b. Use binary interaction parameters based on regression to fit experimental data.
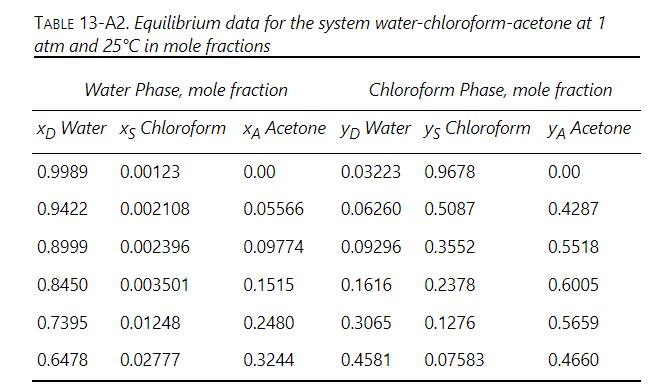
TABLE 13-A2. Equilibrium data for the system water-chloroform-acetone at 1 atm and 25C in mole fractions Water Phase, mole fraction Chloroform Phase, mole fraction XD Water xs Chloroform XA Acetone yD Water ys Chloroform YA Acetone 0.9989 0.00123 0.00 0.03223 0.9678 0.00 0.9422 0.002108 0.05566 0.06260 0.5087 0.4287 0.8999 0.002396 0.09774 0.09296 0.3552 0.5518 0.8450 0.003501 0.1515 0.1616 0.2378 0.6005 0.7395 0.01248 0.2480 0.3065 0.1276 0.5659 0.6478 0.02777 0.3244 0.4581 0.07583 0.4660
Step by Step Solution
There are 3 Steps involved in it

Get step-by-step solutions from verified subject matter experts